Under Armour (UAA)·Q3 2026 Earnings Summary
Under Armour Beats on Adjusted EPS, Raises FY26 Guidance Despite GAAP Loss
February 6, 2026 · by Fintool AI Agent
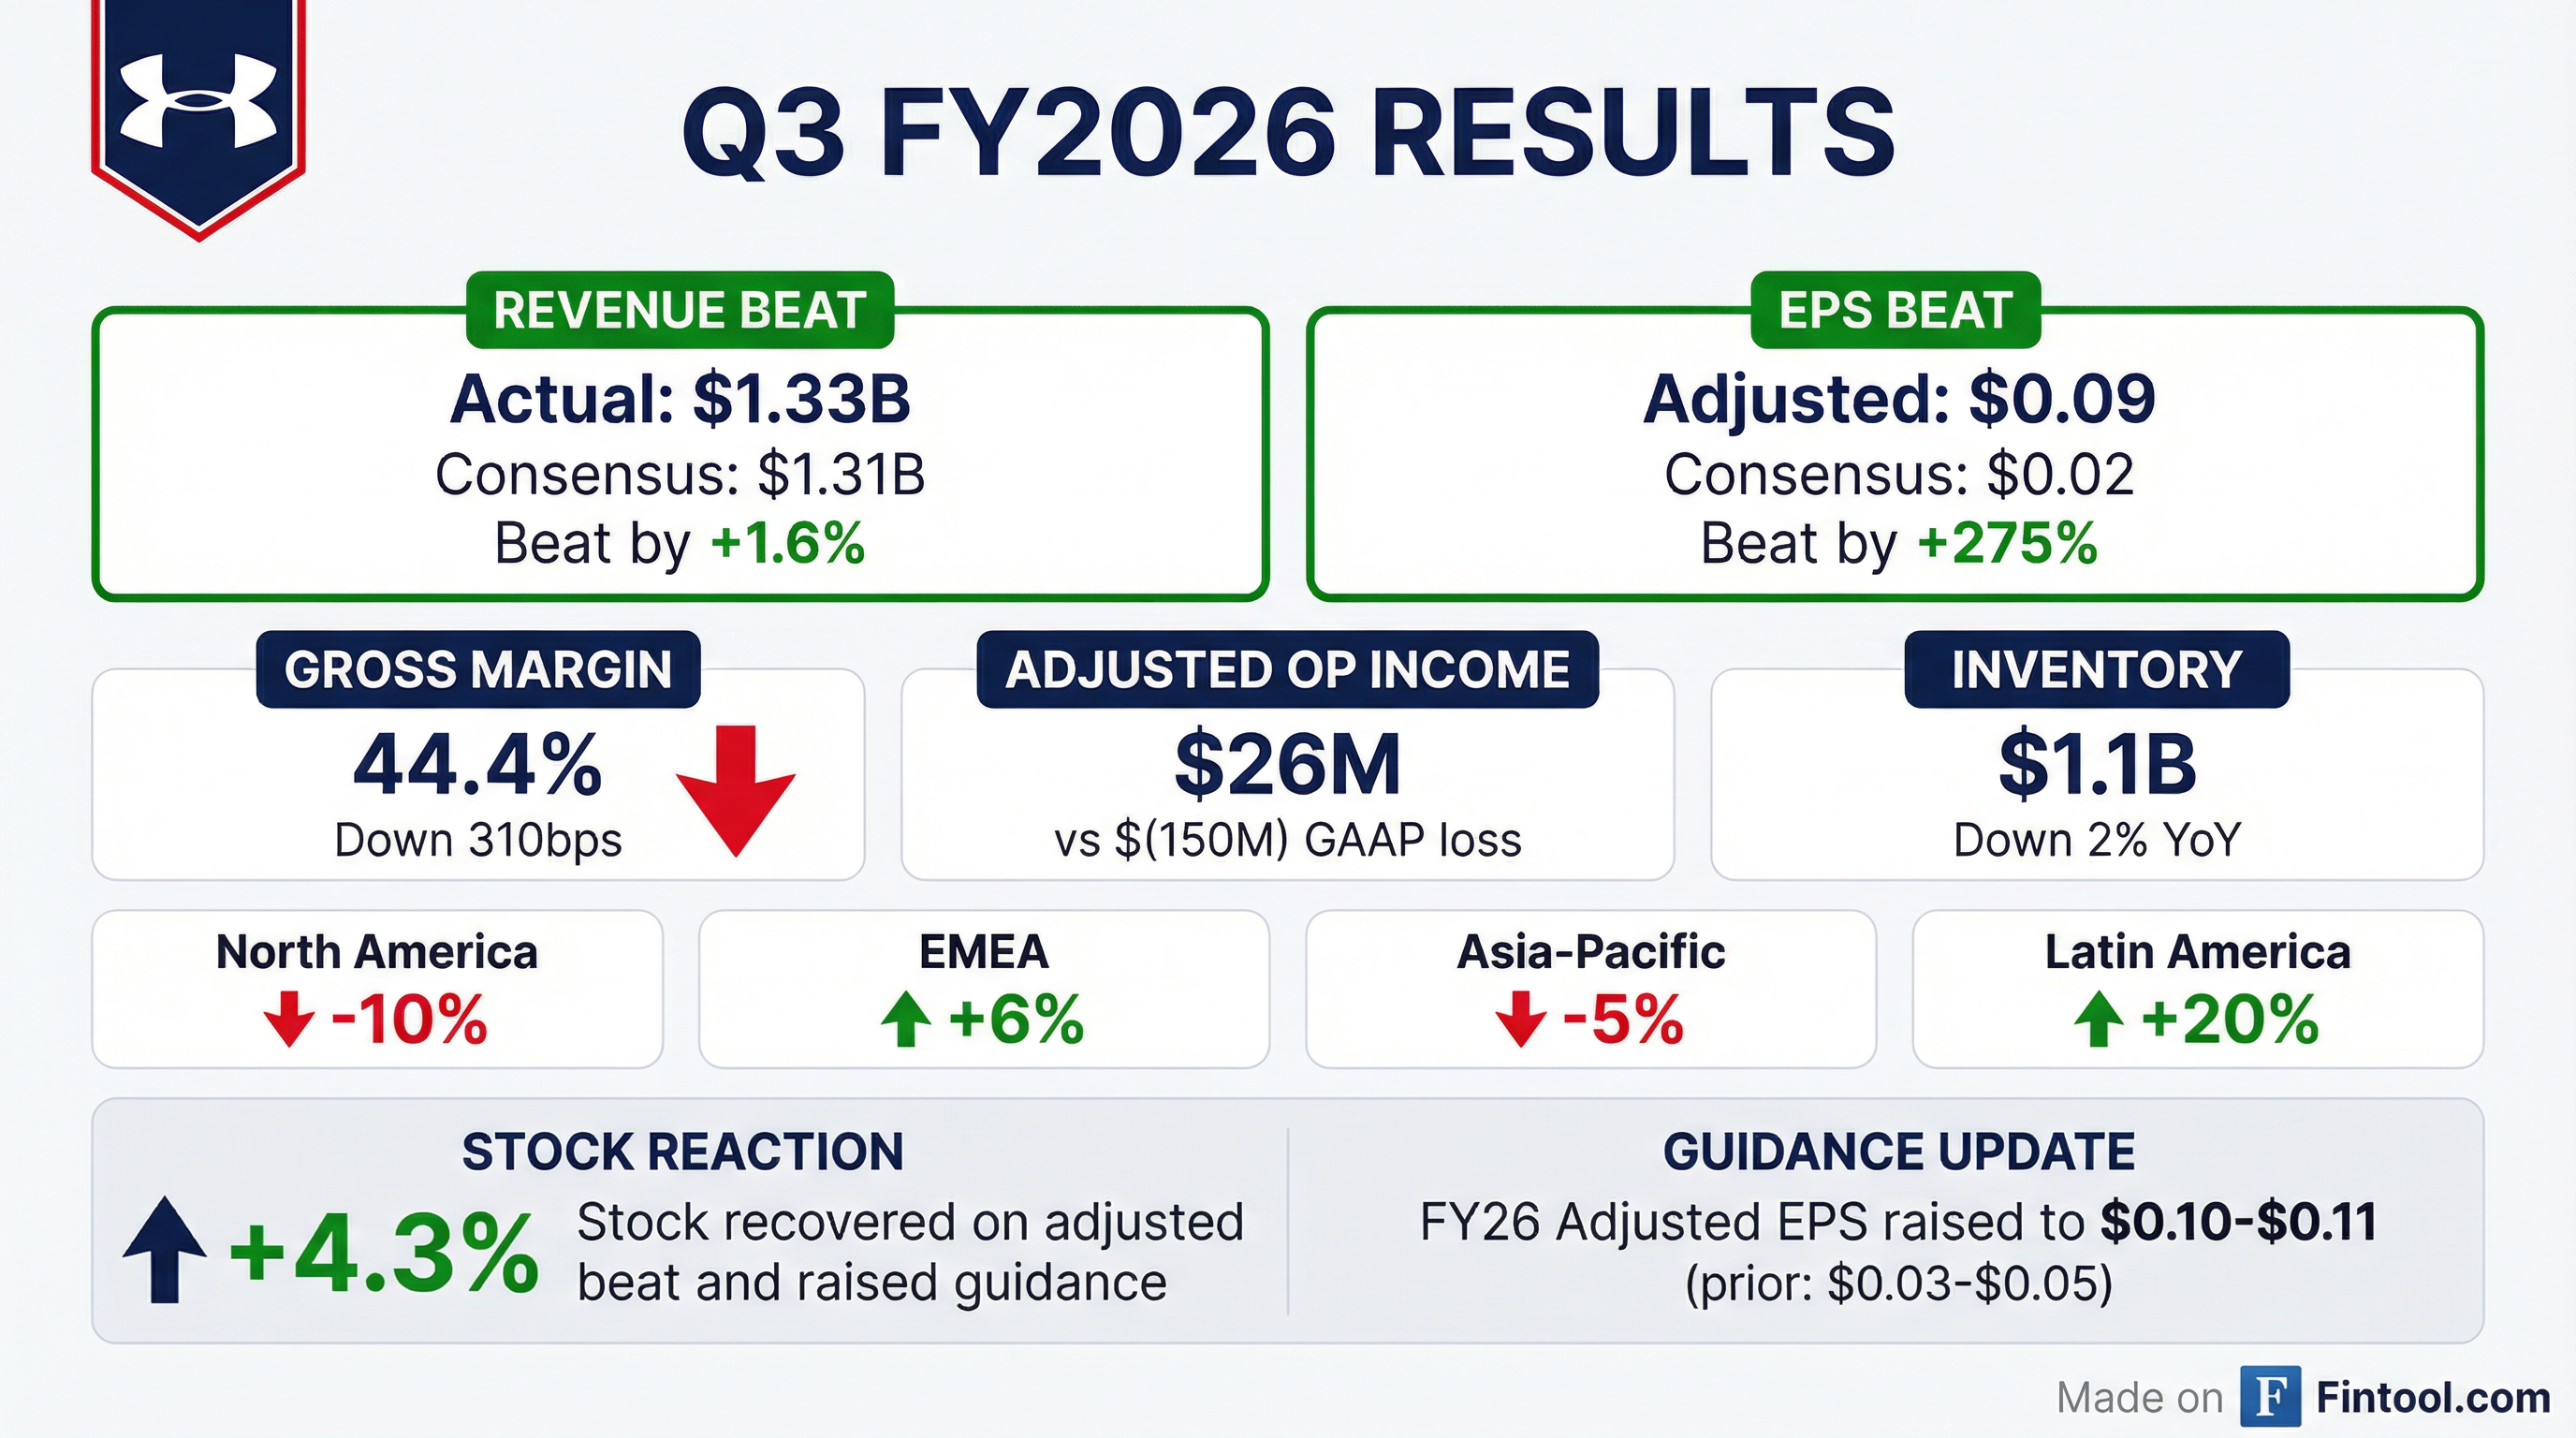
Under Armour delivered a surprise beat in Q3 FY2026, with adjusted earnings of $0.09 per share crushing the $0.02 consensus estimate despite a headline GAAP loss of $1.01 per share. The athletic apparel maker raised full-year guidance and signaled the worst of its North America reset may be behind it, sending shares up 4% in after-hours trading.
Did Under Armour Beat Earnings?
Yes — convincingly on adjusted metrics. Under Armour beat on both revenue and adjusted EPS, though the GAAP numbers were marred by one-time charges:
The GAAP loss included three major one-time items:
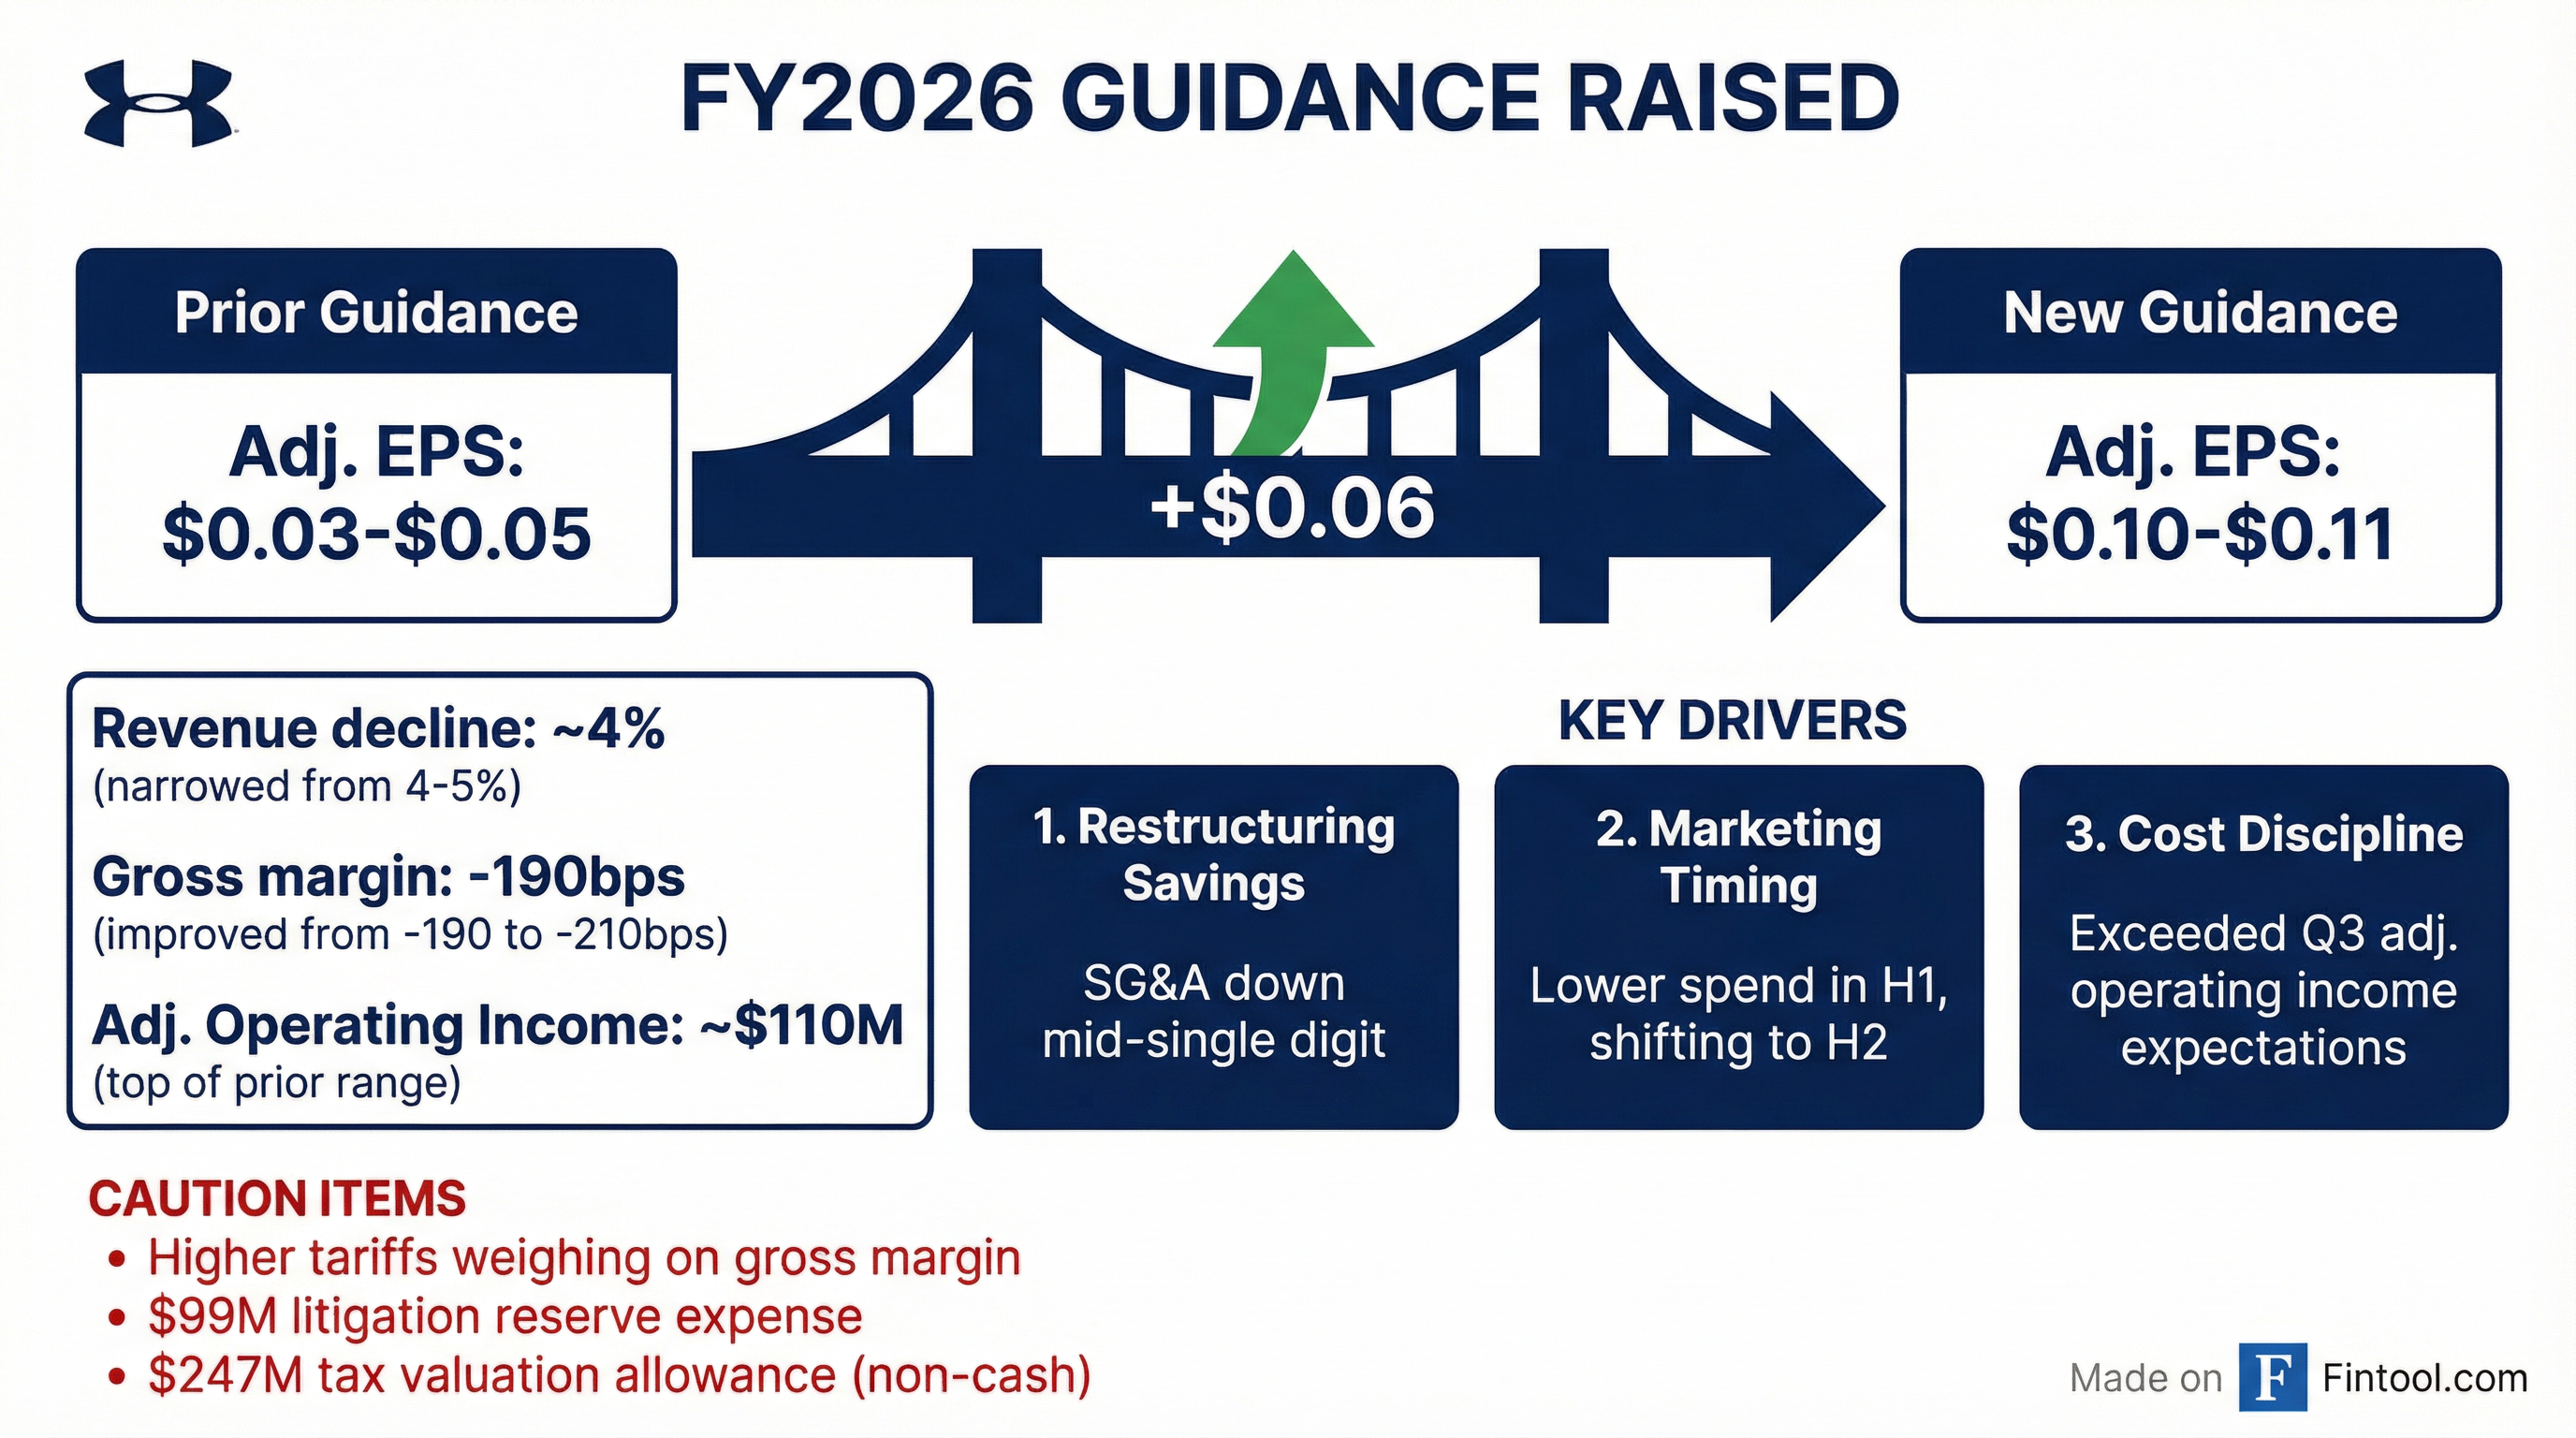
- $247M tax valuation allowance on U.S. federal deferred tax assets (non-cash)
- $99M litigation reserve related to an insurance carrier dispute
- $75M restructuring charges under the Fiscal 2025 Restructuring Plan
Excluding these items, adjusted operating income came in at $26M, beating internal expectations.
What Did Management Guide?
Under Armour raised FY2026 guidance across key metrics, reflecting better-than-expected Q3 performance:
CEO Kevin Plank noted: "Our third quarter adjusted operating results exceeded expectations, and despite a few unfortunate, non-recurring impacts, we're encouraged by the progress we're making in the business to reignite brand momentum."
How Did the Stock React?
Under Armour shares initially traded down ~5% in the regular session to $6.28, likely on the headline GAAP loss of $1.01 per share. However, the stock reversed in after-hours trading:
The after-hours reversal reflects investors digesting the adjusted beat and raised guidance. The stock trades at roughly the analyst consensus price target of $6.27, suggesting limited near-term upside but validation of the turnaround thesis.
What Changed From Last Quarter?
Several key shifts emerged in Q3 compared to Q2 FY2026:
Improving Trends:
- North America inflection: Management called Q3 the "most challenging phase" of the reset and expects "greater stability ahead"
- EMEA momentum: Revenue grew 6% (vs 7% in Q2), continuing to be a bright spot
- Latin America surge: +20% YoY growth, the strongest regional performance
- Inventory health: Down 2% YoY to $1.1B, supporting cleaner sell-through
Continued Headwinds:
- Gross margin pressure: Down 310bps to 44.4%, primarily from higher tariffs
- Footwear struggles: Down 12% YoY, underperforming apparel (-3%)
- Asia-Pacific weakness: Revenue declined 5%, worse than expected
Regional Performance Deep Dive
Revenue by region showed a mixed picture:
North America remains the core turnaround challenge, representing 57% of total revenue. CEO Plank emphasized the company is "sharpening focus and strengthening execution" with "better products, bolder storytelling, and a more disciplined market presence."
Channel & Category Mix
By Channel:
- Wholesale: $660M (-6%)
- Direct-to-Consumer: $647M (-4%)
- Owned stores: -2%
- eCommerce: -7% (38% of DTC)
By Category:
- Apparel: $934M (-3%)
- Footwear: $265M (-12%)
- Accessories: $108M (-3%)
Footwear remains the weakest category, declining for the fifth consecutive quarter. This is a key area to watch for signs of product innovation taking hold.
Restructuring Progress
The Fiscal 2025 Restructuring Plan is progressing, with costs revised upward:
Of the $224M incurred, $89M is cash-related and $135M is non-cash. The restructuring is driving adjusted SG&A down 7% YoY in Q3.
Balance Sheet & Liquidity
Under Armour's balance sheet remains solid despite the GAAP losses:
The $600M in restricted investments is designated for repaying senior notes due in June 2026. No borrowings were outstanding under the $1.1B revolving credit facility.
Forward Catalysts & Risks
Near-Term Catalysts:
- North America stabilization in Q4 (management's most challenging phase is behind them)
- New product launches driving brand heat
- Restructuring savings flowing through P&L
- June 2026 debt refinancing clarity
Key Risks:
- Tariff exposure impacting gross margins
- Footwear turnaround not materializing
- North America wholesale distribution challenges
- Tax valuation allowance signals U.S. profitability uncertainty
The Bottom Line
Under Armour delivered a solid beat on adjusted metrics and meaningfully raised FY2026 EPS guidance. While the GAAP numbers look ugly due to one-time charges, the underlying business is showing signs of stabilization. CEO Plank's turnaround strategy is gaining traction—though the footwear decline and tariff headwinds remain concerns.
The stock's after-hours move suggests the market is giving management credit for execution. The next quarter will be critical to prove North America has truly inflected.
Data sources: Under Armour 8-K filed February 6, 2026; S&P Global consensus estimates